 High-Effort Customers Don't Complain. They Disappear.
Why effort, not satisfaction, is the metric that flags the customers about to quietly walk away.
High-Effort Customers Don't Complain. They Disappear.
Why effort, not satisfaction, is the metric that flags the customers about to quietly walk away.

CX Corner
Issue 50 · 12 March 2026
The (often stolen) thoughts of Wordnerds' CEO, Pete Daykin. A fortnightly Voice of Customer newsletter for people tasked with making business improvement from customer feedback. Contains light swearing, unnecessary personal detail and information about what we're learning here at Wordnerds.
Structural Equation Modelling: The Score Went Down, Anyone Know Why?
The stats technique that tells you which drivers actually moved your score — and which just moved alongside it.
We're Getting Juiced About Structural Equation Modelling. We Didn't Know What it Was Three Months Ago.
Hey there,
Issue 50. This year, Rocky turns 50. Taxi Driver turns 50. Apple turns 50. The Winter Paralympics turn 50. I turned 50. And now, against considerable odds, so does CX Corner. Travis Bickle's entire worldview was built around the conviction that a reckoning was coming—that at some point, the rain would arrive and the accounts would be settled. We offer you no such luxury at our half century point, reader. Sorry. The good news is that the other film of 1976 taught us that you don't have to win. You just have to still be standing at the end. “Yo, Adrian! We did it!”
Thank you so much for being on this journey with us, and particularly those of you who write back, push back, and give us your thoughts. We read every single one... often stealing your best ideas to pass off as our own. Speaking of which, Issue 50. Let’s go!
A few months ago, one of the sharpest CX minds we know said something that got us buzzing. "We just can’t trace brand metrics to the real world." He was talking about his overall satisfaction score. And he's right.
Chris works in customer insight. He's good at it—genuinely, uncommonly good—and he's been wrestling with a problem that will be familiar to anyone who's ever had to present a perception metric to a senior team.
His organisation, like most, sits through a regular review of KPIs. Scores in red, scores in green, one line of commentary each. "This has gone up, hooray. This has gone down, boo-hoo." And then everyone goes back to their desks.
The problem isn't the scores. The problem is that nobody can explain them.
Overall satisfaction—star rating, NPS, your regulator’s brand tracking number, whatever sits at the top of your measurement framework—is, as Chris puts it, "a perception and brand measure." It doesn't tell you what happened. It tells you how people feel about you as an organisation, which is a subtly but importantly different thing.
Crucially, it's a lagging indicator. If it goes down, it might be because your service deteriorated. Or because you happened to contact more dissatisfied customers this quarter. Or because something happened six months ago that's only now showing up in the data. The score doesn't know. It just goes down.
Chris's response was not to shrug and write a line of commentary. He started building a pyramid.
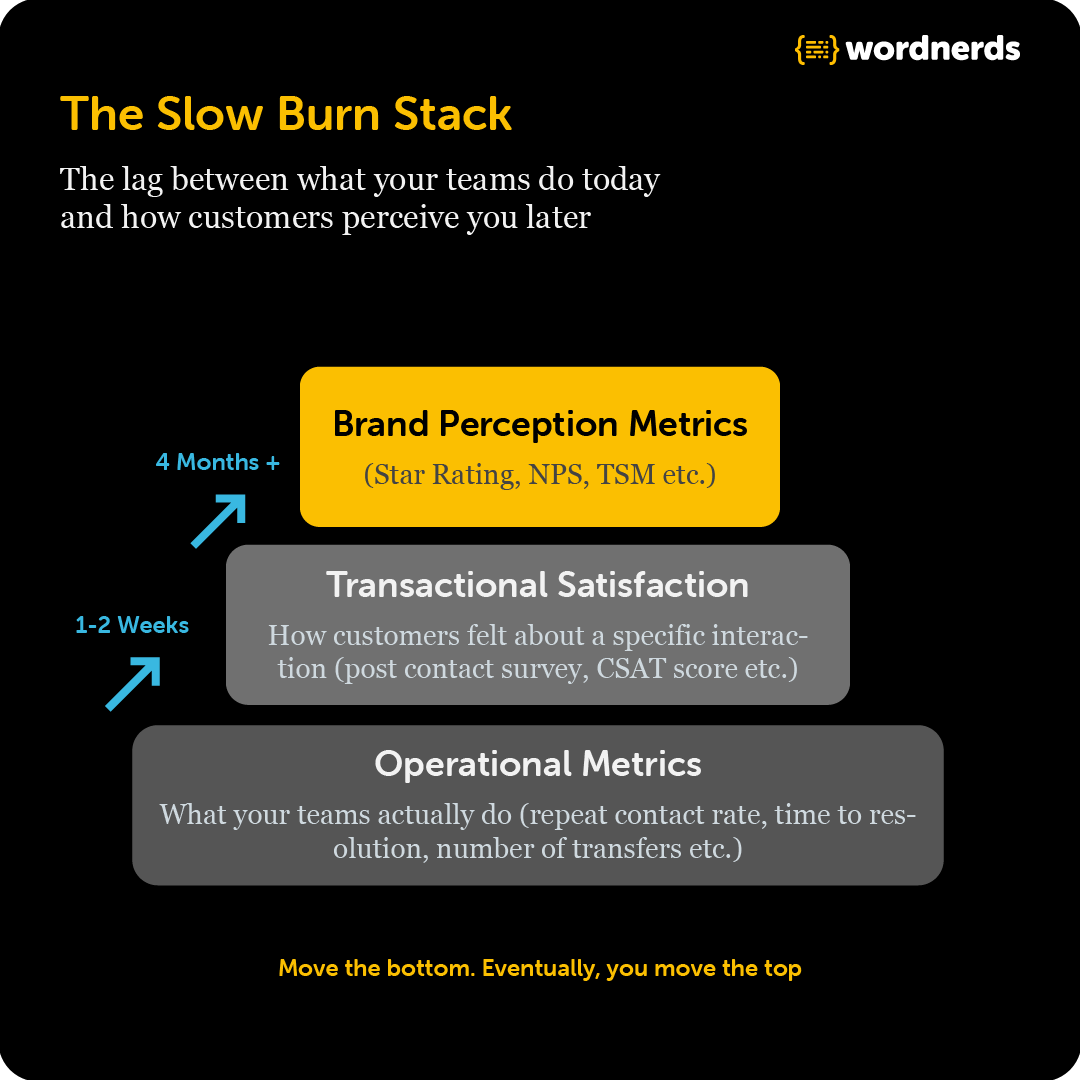
Operational metrics at the base—the things his teams actually control. Transactional satisfaction in the middle—how customers felt about a specific interaction, a specific moment. And at the top, your brand perception metrics: the measures that carry the most political weight, move the slowest, and frustrate everyone who has to explain them.
His hypothesis: move the bottom and you'll eventually move the top. But with a lag.
The maths behind "eventually"
To build those mathematical links, Chris taught himself Structural Equation Modelling—SEM—using R and Python, working largely alone, critiquing his own methodology because there was no one else to do it. "There's no one to tell me it's rubbish," he told us. "I just have to critique myself."
That's not a complaint. It's just the reality of being someone who takes this shit seriously in an industry that is still, largely, measuring brand perception with a survey, a spreadsheet and a licked finger to the air.
SEM has been around in academic research for decades, but it hasn't made much headway in day-to-day CX practice. The idea is this: some things you care about can't be measured directly. Brand trust, perceived service quality, the cumulative experience of living in one of your houses—none of these exist as a number you can simply read off a dial. But they manifest in things you can measure: survey scores, repeat contact rates, resolution times, free text sentiment.
Structural Equation Modelling lets you feed all of those signals in, specify a hypothesis about how they relate to each other, and calculate a path coefficient for each relationship.
Think of a path coefficient as a conversion rate between two layers of the pyramid. If the coefficient between transactional satisfaction and brand perception is 0.6, a ten-point move in transactional satisfaction predicts a six-point move in brand perception—roughly four months later.
The model doesn't just tell you the relationship exists. It tells you how strong it is. Which means you can start to say something like: "If we fix the queue communication problem, here's what we'd expect to see in the brand score by Q3."
The key word is still hypothesis. SEM isn't a black box that discovers connections on your behalf. You have to come in with a theory—"I think ‘time to resolution’ in operational performance drives better CSAT scores in our transactional satisfaction survey, which drives NPS, our brand perception term, with a 6-month lag"—and the model tells you whether it holds, how strongly, and with what timing.
Which is exactly what Chris is doing. He's not trying to automate insight. He's trying to put mathematical rigour behind the intuitions his team already has—so that when transactional satisfaction goes up and brand perception follows four months later, he can say with confidence: that's not a coincidence. That's a result.
Your ceiling metrics are not the problem. Treating them as if they should move faster than they can—that's the problem.
If you've ever sat in a KPI review and thought "I know why this went down, but I can't prove it"—that's the gap Chris is closing. The brand perception number at the top of your pyramid isn't broken. It's doing exactly what it's supposed to do: reflecting the accumulated weight of every interaction your customers have had with you, over time. The frustration comes from expecting it to behave like a transactional metric when it structurally cannot.
What SEM offers the manager trying to make the case for an improvement programme is something priceless: a credible story of mechanism. Not just "our satisfaction score improved," but "here's the pathway—from reduced subcontractor use, to higher repair satisfaction, to a measurable shift in overall perception four months later."
And for the leader trying to change how the organisation thinks about measurement, it offers something more fundamental still: a reason to stop treating ceiling metrics as a proxy for everything, and start treating the base of the pyramid as the place where the real work happens.
So where are we with Structural Equation Modelling?
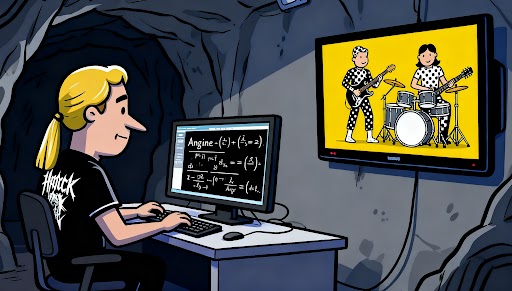
Chris is still in his data cave listening to experimental Sun Ra punk from Quebec* (really!). No clean formula yet. Just a very smart person and a structural equation model that may or may not be rubbish—his words, not ours—working on a frontier problem: the mathematical link between what your teams do and what your board sees.
His early hypothesis is that transactional satisfaction affects overall perception with roughly a four-month delay. If he’s right it means the score his board is looking at today is a reflection of what their service teams were doing last autumn.
Most of us aren't there yet. But you don't need to be to take a first step. The most useful thing you can do right now is ask a simpler question: how well are you analysing your transactional layer? Not just the scores—the language underneath them. Are customers telling you, in their own words, what their experience of you is really like?
Because if you do have that, and you're not using it to explain the ceiling metric above it, that's the gap worth closing first. And if you don't—that's worth knowing too.
At Wordnerds, we're knee-deep in a different problem right now—building Power BI visualisations to explain exactly this, the link between verbatim and scores. Wrestling with data engineering challenges that come with the huge text datasets that Power BI wasn’t designed to handle gracefully.
When we come up for air, pointing some of our nerdiest nerds—Hugh, Steve, Damani—at Structural Equation Modelling feels like our idea of a good time. The kind of Gordian knot that, once untied, changes how the whole field thinks about measurement.
None of us have the answer yet—but if you're working on something similar, or if you just want to compare notes with people who find this kind of thing exciting, you know where we are.
Hope this was a fitting way to mark our big number. Until next time, keep learning!
Pete
P.S. We deliberately haven't gone too far into the maths behind structural equation modelling. It's too much for a Thursday. However, for the hardcore data nerds amongst you, there is a brilliant introduction to the technicalities behind these ideas here.
*Angine de Poitrine. Just if you’re curious. It’s pretty sick.
More from CX Corner
High-Effort Customers Don't Complain. They Disappear.
Why effort, not satisfaction, is the metric that flags the customers about to quietly walk away.
 You Can't Improve What You Can't Compare
A score on its own tells you almost nothing. Benchmarking is what turns it into something you can act on.
You Can't Improve What You Can't Compare
A score on its own tells you almost nothing. Benchmarking is what turns it into something you can act on.
 Customer Emotion Mapping: World Cup Edition
Score more than you concede: every process produces an emotion, and the emotion is the only part your customer remembers.
Customer Emotion Mapping: World Cup Edition
Score more than you concede: every process produces an emotion, and the emotion is the only part your customer remembers.
