Skip to content
 

See Every HHSRS Hazard in Your Tenant Feedback

Which hazards, how they're changing, and where to focus.

awaabs law

We'll take your tenant feedback — complaints, repairs, surveys, calls — and run it through the same hazard categorisation framework used by Guinness Partnership.

You'll get back:

  • An HHSRS hazard report covering every hazard in your data
  • Tenant satisfaction drivers across your feedback
  • A Power BI dashboard you can take straight to the board
  • A workshop with your team to walk through the findings

Launch offer: £4,900 + VAT (usually £5,775). Register by 16th March.

Register your interest and we'll be in touch to talk through how it works.

Register Your Interest

Trusted by a range of UK Housing Associations (From About 3k Homes Under Management to 80,000+) 


You've got the deadline. Now you need the data.

Hazards show up across complaints, repairs, calls, surveys, and routine correspondence.

Pulling all of that together into one view is a manual job most teams don't have capacity for — especially with everything else on your plate.

And in Wales, the enforcement mechanism is direct: tenants can withhold rent if hazards aren't addressed. This report gives you that clear picture.

sleeping dragon
 

Your data. Every hazard. One report.

Your data, run through a hazard categorisation framework already in use by housing associations across England — covering every HHSRS hazard — with findings you can actually act on.

Everything you need to show the board where you stand.

1. HHSRS hazard report Every hazard identified across your tenant feedback — not just complaints, but repairs, surveys, and calls. You'll see the size of each hazard, which channels it's appearing in, and whether it's getting bigger or smaller. Instead of piecing it together manually, you'll have it all in one place.

2. Tenant satisfaction drivers Beyond hazards: what's actually driving satisfaction and dissatisfaction across your feedback? This gives you a baseline — so when the board asks "are things getting better?", you'll have the numbers to prove it.

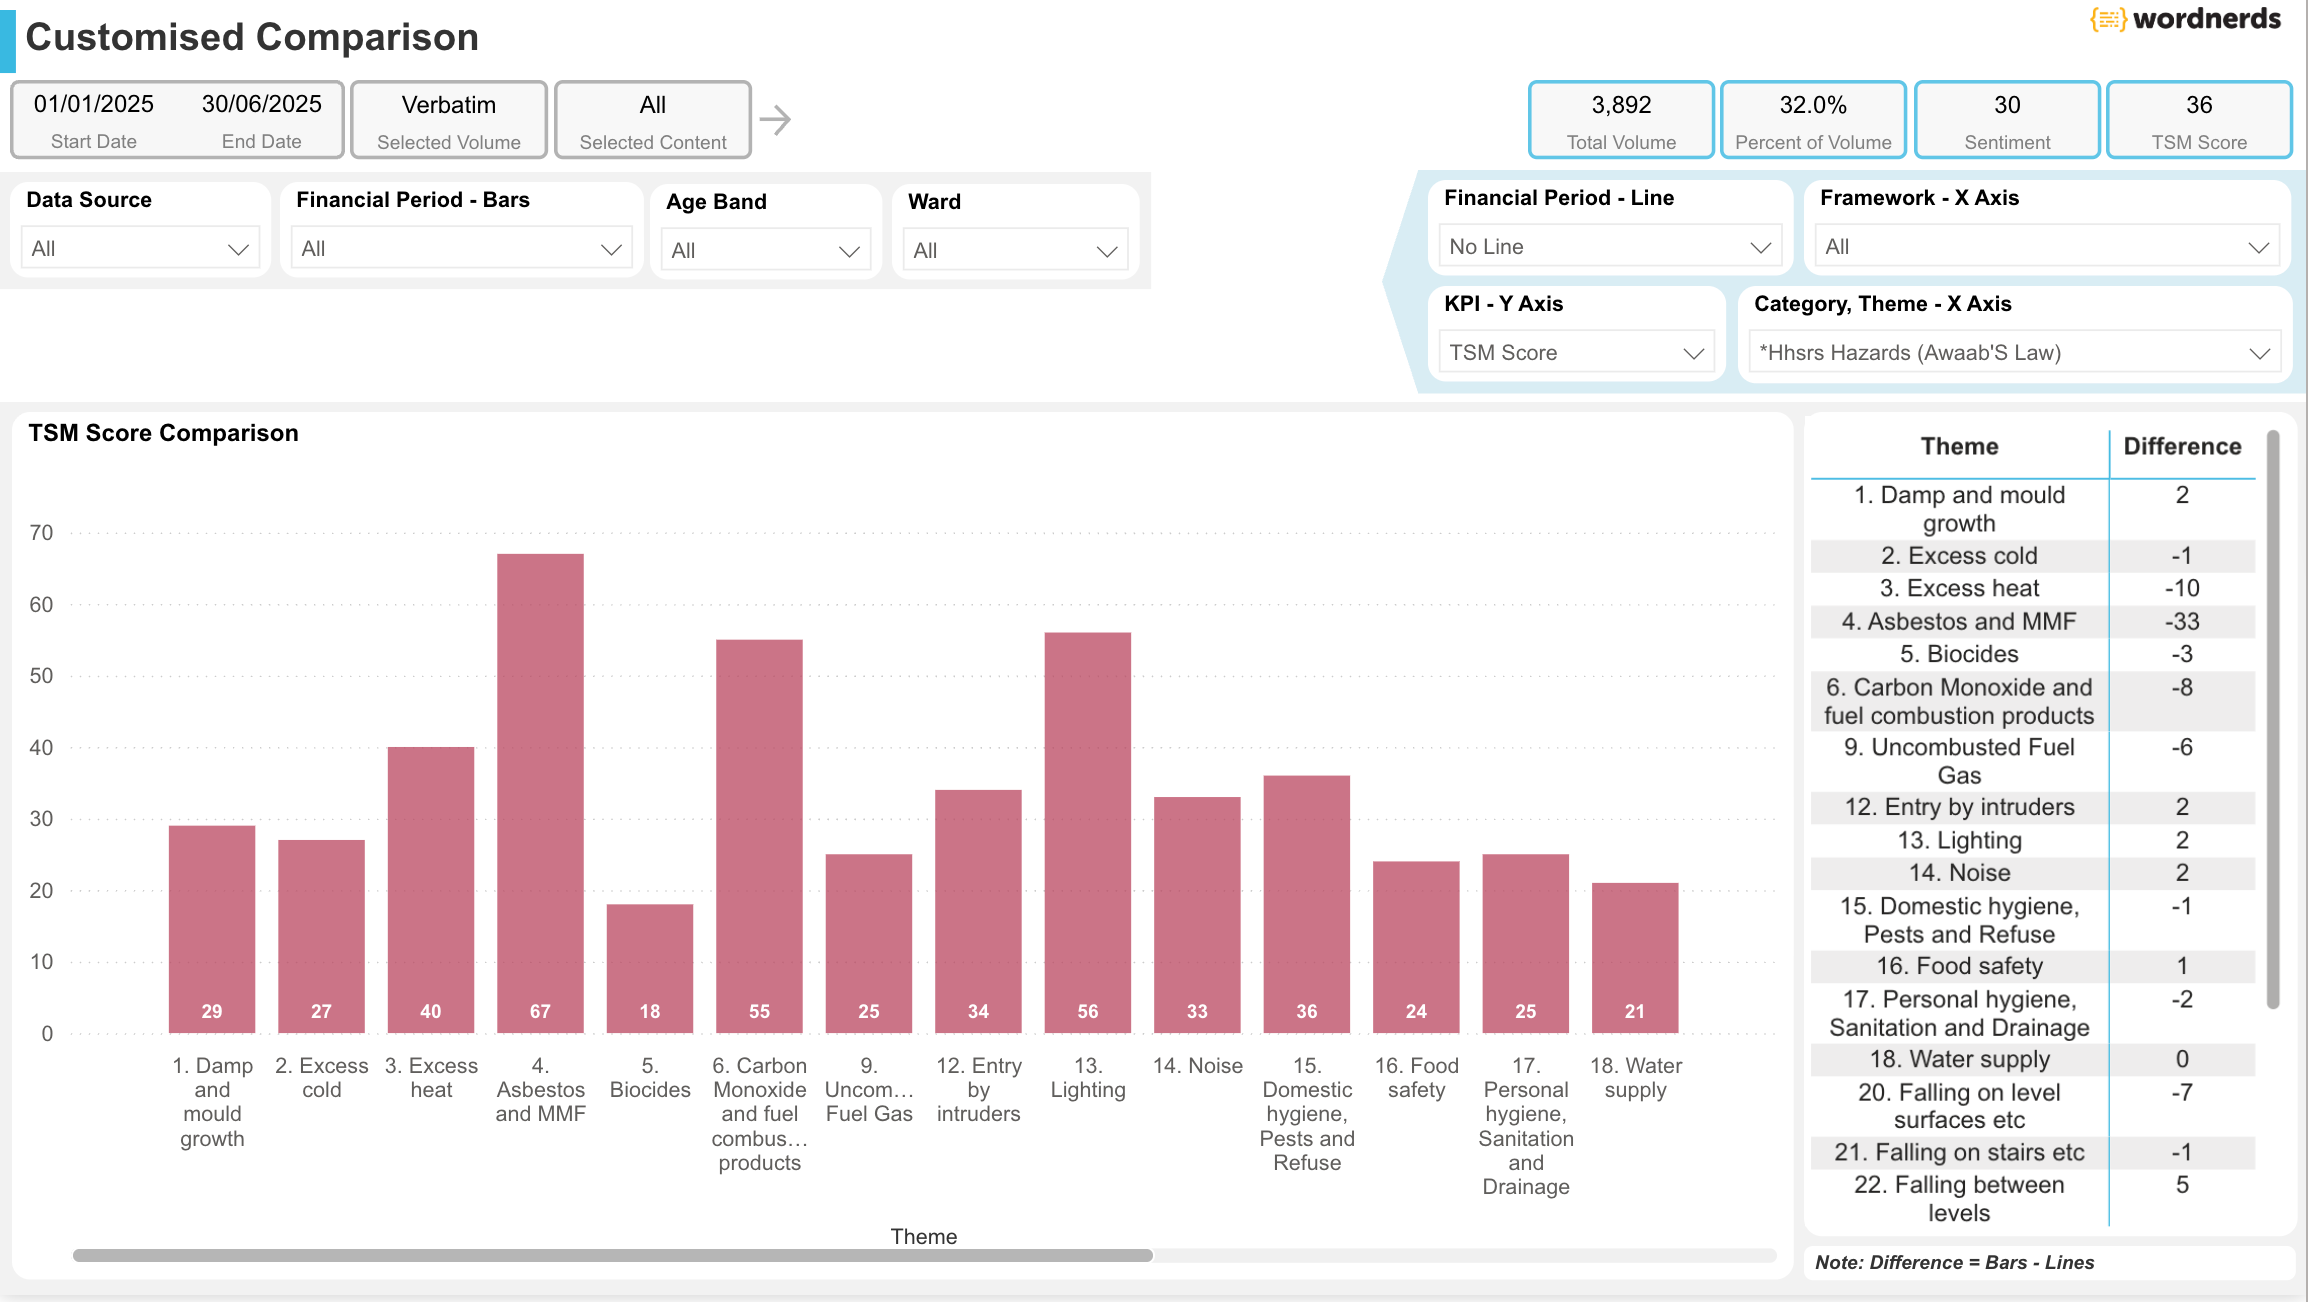
3. Power BI dashboard Visuals you can actually present to your leadership team — not a static PDF that dates the moment you print it. A working dashboard your team can filter, explore, and come back to. When someone asks for an update, you open it, not rebuild it.

4. Workshop with your team We'll walk your team through the findings — what the data shows, where to focus, and how to use the framework going forward. This is where it stops being a report and starts being a plan. Included with every report, no extra charge. 

Why this works

We don't use keyword matching. We train context-based themes that understand why a tenant mentioned something, not just that they mentioned it. That's how you catch the excess cold issue buried in a repairs request about a boiler — and it's why the framework covers every HHSRS hazard, not just the obvious ones.

The shift

Instead of scraping together hazard data from different systems and hoping you've caught everything, you'll know exactly where you stand — with evidence your leadership can see and a framework your team can use going forward.


Built on a framework that's already working

Guinness Partnership

This framework is already working. It's being used operationally by English housing associations — including Guinness Partnership, who were one of the first to cover every HHSRS hazard from day one.

We helped them do it. Now we're making the same framework available to Welsh HAs — applied to your data, on your timescale.

"We demonstrated there was a higher incidence of damp and mould if that topic had been triggered by the customer. It allowed me to turn a loose hypothesis into something data-led."

Chris Haynes, Head of Customer Insights


Launch Pricing for Welsh housing associations

We're running a launch offer for Welsh HAs who register their interest before 16th March — ahead of the April 1st deadline.

Demo

Register by 16th March

Launch Price
£4,900 + VAT

Online Report

After Deadline

Standard Price
£5,775 + VAT

This includes the full hazard report, tenant satisfaction drivers, Power BI dashboard, and a workshop with your team. Multiple data sources included — the more you can share with us, the more valuable the report.


What happens next

1. Register your interest Fill in the form and we'll be in touch.

2. We'll talk through how it works We'll explain what data we need, what the report covers, and answer any questions. No pressure, no hard sell.

3. You'll go through your usual process Procurement, data sharing agreement, whatever your organisation needs. We know — every housing association has a procurement process. We've navigated enough of them.

4. We run your data through the framework Once we have your data, you'll have your report within 30 days. We'll walk you through the findings and run the workshop with your team.

happy lady
 

April's coming. Know what's in your data.

Register your interest and we'll talk you through it.


FAQs

What data do I need to provide?

We'll discuss specifics when we speak, but generally: any tenant feedback you have. Complaints, repair requests, survey comments, contact centre notes. The more sources, the more complete the picture. We typically work with 1-2 years of historical data.


How long does the process take?

Once we have your data, you'll have your report within 30 days.

Is my data kept confidential?

Yes. Your data is yours. We don't share it, aggregate it, or use it for anything beyond your report without your explicit permission.

What happens after the report?

The report gives you a point-in-time view. If you want ongoing, automatic hazard categorisation across all your feedback channels — that's where our subscription comes in. We'll talk through the options, but there's no obligation to go beyond the report.


Can't see the Answer to Your Question? Worried about Anything?

Please just ask. We're dead friendly and we won't try to sell you stuff, honest!