 You're not ignoring tenant safety. You're just finding out too late.
Under Awaab's Law, a tenant survey comment is a compliance trigger. Here's what an early warning system actually needs.
You're not ignoring tenant safety. You're just finding out too late.
Under Awaab's Law, a tenant survey comment is a compliance trigger. Here's what an early warning system actually needs.
Regulation & Benchmarks

What 135,000 tenant voices revealed: the Wordnerds × Housemark Social Housing Benchmarking Report 2026
We analysed 135,000+ anonymised TSM survey comments from 18 housing associations with Housemark — not the tick-box scores, but the free text tenants write when they have something they actually want to say. On four separate counts, the words told a different story from the boxes.
Created
Across 135,000 tenant comments, the most dangerous group in your TSM data isn't the one ticking "dissatisfied." It's the one ticking "fairly satisfied"—and writing something that scores 44 out of 100 on sentiment. Wordnerds and Housemark analysed the free-text behind the scores from 18 housing associations, and on four separate counts the words tenants wrote told a different story from the boxes they ticked.
That's the whole point of the benchmark. A TSM score tells you what a tenant selected from five options. It doesn't tell you why, where the risk is concentrated, or what's about to move in the wrong direction. The verbatim does—if you can read it at scale.
What is the Wordnerds × Housemark TSM benchmark?
The Wordnerds × Housemark TSM benchmark is the UK's first qualitative analysis of Tenant Satisfaction Measure free-text comments—135,000+ anonymised responses from 18 volunteer housing associations, collected between January 2023 and mid-2025. Wordnerds turns what customers say into what organisations do: we applied transparent, explainable AI to surface themes, sentiment, journey stages and effort across every comment, then benchmarked the patterns across the sector.
Most TSM benchmarking pools the numbers landlords submit to the Regulator of Social Housing. This one sits underneath those numbers, in the words tenants write to explain their answer. Comments were themed and scored with sector-tuned models, broken down by organisation size, and aggregated so no individual association is identifiable. The output is auditable—every theme traces back to the comments behind it, which is what makes it defensible in a board paper or a regulator conversation.
Why don't TSM scores tell you the whole story?
TSM methodology groups "fairly satisfied" with "very satisfied" as positive responses. The words tell a different story. Across the benchmark, "fairly satisfied" tenants score 44 out of 100 on sentiment—11 points below "very satisfied," but only 10 points above "fairly dissatisfied." By sentiment, they sit closer to your unhappy tenants than your happy ones.
It gets sharper by category. In repairs and communication—the two areas under the most regulatory scrutiny—only "very satisfied" tenants are net-positive on sentiment. The "fairly satisfied" group is, on average, mildly negative. So a landlord reporting 60% overall satisfaction isn't looking at a contented majority. A big slice of that 60% is writing in language that reads as frustration, filed under a score that reads as fine. The comforting average is the most expensive number in your dataset, because it hides the people most likely to leave or escalate.
→ Read the deep dive: TSM vs Sentiment: why 'fairly satisfied' is a red flag
Where does the repair journey actually break?
Not where most teams look. When we mapped tenant comments to the stages of a repair, the cliff edge is the wait—not the work. Booking a repair scores sentiment 45 (TSM 76) across roughly 1,194 comments. Waiting for the appointment scores sentiment 25 (TSM 45) across 3,442 comments—a 20-point sentiment drop, and nearly triple the volume. It's the single lowest-scoring point in the entire journey.
Your contractors aren't the problem. Operative conduct recovers sentiment to 53 once someone turns up—strong work—but it never quite climbs back to where booking started, because the damage was done in the silence beforehand. A tenant who knows the appointment is next Wednesday can plan their week. A tenant who hears "someone will be in touch" spends a fortnight re-juggling childcare and work, and writes "I gave up chasing them." That's not dissatisfaction; it's disengagement, and it's a different problem to fix.
→ Read the deep dive: Your repair scores aren't stuck because of bad contractors
What are tenants measuring that you aren't?
Effort. There's no TSM question for it, but 16.2% of tenants—one in six—describe putting in unnecessary effort to get something sorted. When we categorised that effort, it split four ways: time-based (55%), cognitive (27%), emotional (26%) and physical (4%). A single comment can carry more than one, which is why they overlap.
More than half of it is about time—not complexity, not having to make a trip, just time. And the most damaging form is time spent in limbo, waiting without knowing. The encouraging part is that time-based effort is also the most operationally fixable: you can't easily remove a tenant's anxiety, but you can give them a date and a text when it changes. The drivers bear this out—quick response (+41.15) and reliable service (+40.58) are the two biggest positive movers of TSM scores in the whole benchmark. Tenants don't need you to be faster so much as clearer.
→ Read the deep dive: Stop chasing satisfaction. Start measuring effort.
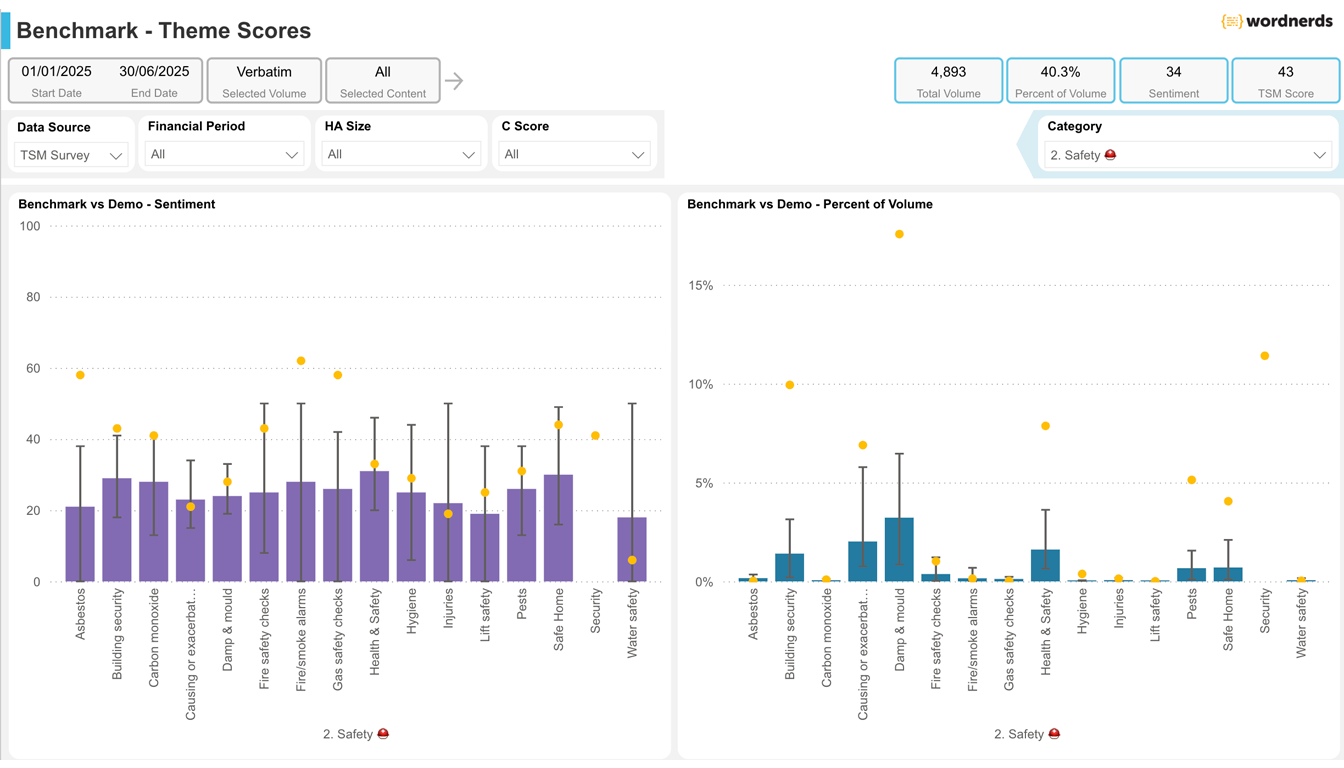
Why is safety the finding that should worry you most?
Because it's binary. Most tenants never mention safety—if their home feels secure, it doesn't cross their mind. But when one does raise it, satisfaction doesn't dip, it collapses. Security issues are the single largest negative driver in the benchmark: around 36 points off the TSM score. That nearly cancels out the biggest positive driver you have.
Damp and mould lives inside that category. It's 4.9% of comment volume, but where it appears the numbers are stark—sentiment 23, TSM 36 against a sector average of 64—and it rarely travels alone. Tenants writing about mould frequently mention health in the same breath: asthma, a child's chest, breathing. Under Awaab's Law, that comment isn't just feedback—it's a hazard report, and the clock starts whatever channel it arrives through, including a free-text survey box. If your process only flags comments containing the word "mould," you're missing the ones that say "the walls are always wet." This is exactly the kind of signal you cannot afford to read manually, three months late.
→ Read the deep dive: You're not ignoring tenant safety. You're just finding out too late.
What do these findings mean for housing CX leaders?
One thread runs through all four: the score is the headline, the verbatim is the story, and only the story tells you what to do. "Fairly satisfied" looks like a safe baseline until you read it. A decent repairs score looks like success until you stage the journey. No effort question means no visible problem—until one in six tenants tells you anyway. A low count of safety mentions looks like a clean bill of health until you see what each one does to the score.
Reading 135,000 comments by hand isn't an option, which is where we come in—we would say that, wouldn't we. But the principle stands without us: you need the qualitative and the quantitative from one auditable source, so the "what" and the "why" line up and a board can see the evidence behind every priority. That's the difference between walking into your next board meeting guessing, and walking in with the sector benchmark behind every number. Your peers in this dataset can already do that. The question a board will ask is where you sit against them—and "fairly satisfied" is not the answer that makes that question go away.
Cite this research
Wordnerds & Housemark (2026). The Wordnerds × Housemark Social Housing TSM Benchmark. Retrieved from https://wordnerds.ai/blog/wordnerds-housemark-benchmarking-report-2026
Last reviewed 24 June 2026. Next review: 24 September 2026, or on the next benchmark data collection.
Frequently asked questions
What is the Wordnerds × Housemark TSM Benchmark Report 2026?
The UK's first qualitative TSM benchmark — an analysis of 135,000+ anonymised free-text TSM survey comments from 18 volunteer housing associations, run jointly by Wordnerds and Housemark. Rather than pooling numeric scores, it analyses the words tenants write to explain their answers, surfacing the drivers, risks and patterns hidden beneath the headline figures.
How was the benchmark data collected?
Eighteen UK housing associations volunteered their anonymised TSM survey free-text responses covering January 2023 to mid-2025. Wordnerds applied its AI text-analysis platform to categorise comments by theme, sentiment, journey stage and effort type. Associations remain pseudonymised throughout, and results are broken down by organisation size so peer comparison is meaningful.
Why do TSM scores and sentiment scores diverge?
TSM scores capture what tenants choose from five options; sentiment analysis reads the meaning and tone of what they actually write. Across the benchmark, "fairly satisfied" tenants — grouped with "very satisfied" as positive in TSM methodology — score 44 out of 100 on sentiment, sitting closer to dissatisfied than satisfied. The verbatim reveals risk the score conceals.
What are the biggest drivers of TSM scores in the sector?
Driver analysis identifies quick response (+41.15) and reliable service (+40.58) as the strongest positive drivers. On the negative side, security issues are the single largest factor (around −36 points), followed by damp and mould, incomplete repairs, and long waits for appointments. Proactive communication and reliable scheduling move scores more than most operational metrics suggest.
How can I see how my organisation compares to the benchmark?
Book a diagnostic with the Wordnerds team. We'll map a sample of your tenant verbatim against the sector benchmark — your sentiment profile by theme and journey stage, where you sit against peers on effort and safety signals, and what to prioritise. The conversation is free and takes around 45 minutes.
Read more from the blog
You're not ignoring tenant safety. You're just finding out too late.
Under Awaab's Law, a tenant survey comment is a compliance trigger. Here's what an early warning system actually needs.
 Stop chasing satisfaction. Start measuring effort.
One in six tenants in our Housemark benchmark described putting in unnecessary effort to get something sorted. Effort predicts loyalty better than satisfaction does.
Stop chasing satisfaction. Start measuring effort.
One in six tenants in our Housemark benchmark described putting in unnecessary effort to get something sorted. Effort predicts loyalty better than satisfaction does.
 Your repair scores aren't stuck because of bad contractors
55% of repair complaints aren't about the repair. They're about the wait. Here's what the benchmark data shows — and what to do about it.
Your repair scores aren't stuck because of bad contractors
55% of repair complaints aren't about the repair. They're about the wait. Here's what the benchmark data shows — and what to do about it.
