Data completeness 💯
Goal
Ensure your quantitative metrics (CSAT scores, NPS scores) accurately reflect your complete response set when presenting to stakeholders.
Actions in the Platform
-
Re-upload your data or adjust your current setup to include responses that have quantitative scores but no verbatim feedback
-
Note: While blank verbatim responses can impact sentiment calculations in Wordnerds, this won't affect Power BI calculations
Results in Power BI
-
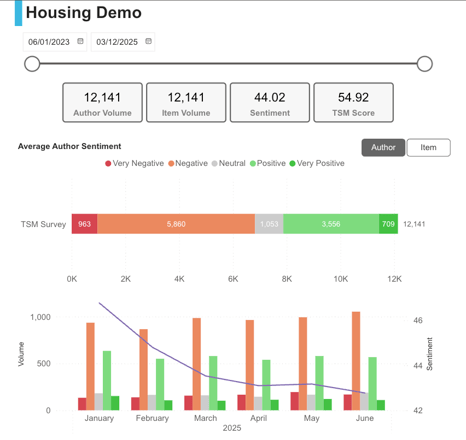
Accurate and comprehensive quantitative metrics in your dashboards
-
Metrics showing both total survey responses ('responses' or 'author') and total verbatim items ('items')
-
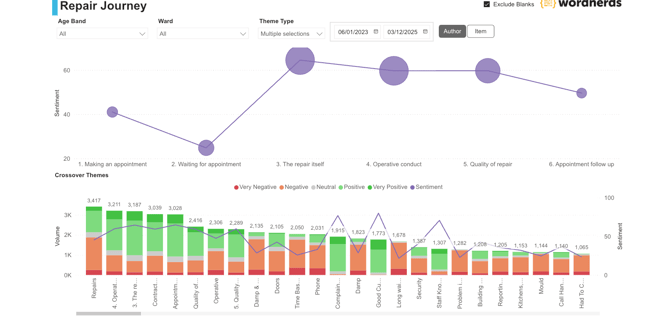
Option to toggle and exclude blanks if needed
Set Up Your Fiscal Calendar 📆
Goal
Enable stakeholders to view and filter data according to familiar reporting periods and fiscal calendars.
Actions in the Platform
-
Upload your fiscal calendar to your Wordnerds project
- For how to action this, see our guide here
Results in Power BI
- Easy filtering by familiar time periods (e.g., "Period 5 data")
- Intuitive navigation aligned with organisational reporting cycles
- Consistent reporting periods across all dashboards
Prepare Your Key Metrics 📈
Goal
Present scoring metrics in formats that align with stakeholder expectations and company standards.
Actions in the Platform
-
Group NPS scores (1-10) into detractors, passives, and promoters during setup
-
Create CSAT groupings (e.g., "satisfied" vs. "dissatisfied")
-
Share calculation methods with us (average scores or bespoke company formulas)
-
Ensure key metric themes have clear, recognisable labels
Results in Power BI
-
Metrics displayed according to your preferred groupings
-
Automated calculations based on your specified formulas
-
Clear, professional metric presentations that stakeholders instantly understand
Tidy Up Your Themes 🧹
Goal
Create a clean, professional theme structure that new audiences can easily navigate and understand.
Actions in the Platform
-
Review and clarify theme names (e.g., change "Delivery Times" to "Delivery Lead Times")
-
Comfort check abbreviations
-
Organise all themes into appropriate categories
-
Remove duplicate themes (often a result of multi-user projects!)
-
Archive unused or outdated themes
-
Clearly label similar themes across different journeys (e.g., "In-store Experience" vs. "Digital Experience")
Results in Power BI
-
Easy, intuitive theme navigation
-
Clear differentiation between similar concepts
-
Stakeholders understand what pages are showing them without additional explanation

Identify your Frameworks
Goal
Create focused, targeted views that highlight specific business objectives or customer journeys.
Actions in the Platform
-
Create frameworks as curated collections of related themes
-
Build frameworks around key areas such as:
-
Customer Journey stages (eg. awareness, consideration, purchase, support)
-
Top Pain Points for weekly tracking
-
Regional or geographical groupings
-
Product or service categories
-
Results in Power BI
-
Ability to filter to your preferred framework
-
Focused dashboards that cut through noise
-
Priority insights highlighted for specific stakeholder groups
-
Simplified navigation to relevant data sets
6. Prioritise your Filters
Goal
Provide stakeholders with quick access to their most frequently used data views.
Actions in the Platform
-
Identify 2-3 filters beyond standard date range and brand filters
-
Examples could be filters such as:
-
Geographic regions, store locations or stations
-
Account types
-
Product categories
-
Customer segments
-
- Let us know in your BI briefing call and we'll ensure to build these in to your views
Results in Power BI
-
Essential filters prominently displayed at the top of pages
-
Quick navigation to relevant data segments
-
Reduced time to insight for stakeholders
![]()
Ready to Launch 🚀
Once you've worked through these preparation steps, your Wordnerds project will be ready for a smooth Power BI integration (or just sparkly clean and tidy for your own appreciation!). Your data will look professional, your insights will be clearly organised, and your stakeholders will have the filtering tools they need to find relevant information quickly.
Remember, the goal is to make your valuable customer feedback insights accessible and actionable for a broader audience. Taking time to prepare your project properly will pay dividends in stakeholder engagement and data adoption across your organisation.
 ✍️ Article written by: Lyndsay, Senior Customer Success Manager
Still in need of some help? Give us an email on support@wordnerds.ai or reach out to your CSM directly.