1. Sentiment analysis
What is sentiment analysis?
Sentiment is a numerical score representing how positive or negative the selected text is.
Each piece of text receives a sentiment score ranging from 0 to 100, indicating how negative or positive the feedback is (0 is very negative, 100 is very positive).
Here's how you'll see sentiment represented throughout the platform - the number in the middle of the ring shows the aggregated sentiment score, and the coloured ring represents the proportion of positive, neutral, and negative comments 👇
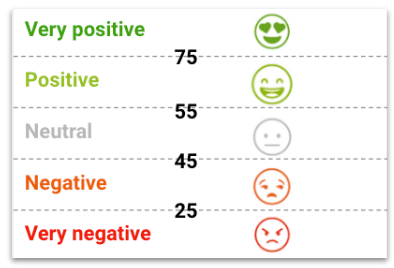
 Based on the score, the text is grouped into a category from 'very positive' to 'very negative', using these boundaries 👇
Sentiment is assigned at different levels in the platform:
- Data set: where we take a mean average of the scores of the individual posts included in your filtered data set and display it on a 0-100 scale, which is referred to as aggregated sentiment. This is particularly useful for tracking sentiment over time.
- Post: an individual piece of verbatim (e.g. one social media post, one survey question response), where the platform takes a mean average of the sentiment scores across the sentences.
- Sentence: with each sentence given a probability of being in 1 of the 5 sentiment categories and the most likely group assigned.
- Individual theme/topic: especially useful for longer entries that contain a mix of praise and criticism, or to understand how customers feel overall about a specific issue. Theme/topic sentiment is determined by taking an average of the sentiment of all sentences containing that theme/topic.
💡Why does sentiment matter?
Understanding not only what people are saying but also how they feel about it is crucial. Sentiment analysis offers a dependable method to assess positivity and negativity, simplifying the process compared to manual tagging, which can be subjective and inconsistent. By analysing sentiment, you can gain meaningful insights that guide your next actions. Monitoring sentiment trends over time allows you to evaluate the effectiveness of your interventions - if sentiment improves, your efforts are likely resonating; if it declines, you can pinpoint areas that need attention.
The nerdy bit
Our sentiment model is built on transformer technology - a type of machine learning model that's exceptionally good at understanding language.
Here's how it works:
The algorithm examines every aspect of a sentence: grammar, syntax, meaning of individual words, and how those words interact with each other. By looking for patterns in this data, and then patterns in those patterns, the model builds thousands of numerical representations of each sentence.
When building the model, we ran millions of sentences (pre-tagged as positive or negative) through this process, so the system learns what positive and negative language actually looks like.
Emojis and context
Emojis reveal information that words alone don't capture. For example, "Great service 🙄" tells a very different story to "Great service ✨" the emoji helps us identify sarcasm, emotion, and the true sentiment behind the text. Our model is trained to recognise and interpret these contextual clues.
Removing bias
All AI models inherit the biases present in the data they're trained on including gender bias, name bias, and cultural bias. We've built debiasing into our model to ensure your sentiment scores reflect what customers actually feel, not societal prejudices. Here's what we do:
-
Replace names with a generic placeholder so the model isn't influenced by gender or cultural associations
-
Replace gendered language (she, he, his, hers) with neutral pronouns (they, them)
-
Remove company name references so sentiment is based on the feedback itself, not brand recognition
This model has been effective, while it isn't perfect, we have seen a distinct improvement on leading NLP providers like Google NLP and IBM Watson, especially on complex issues like sarcasm. No sentiment analysis can be 100% accurate (ours is more like 90-95%!) – and if anything doesn't look right, you can manually edit sentiment in the platform.
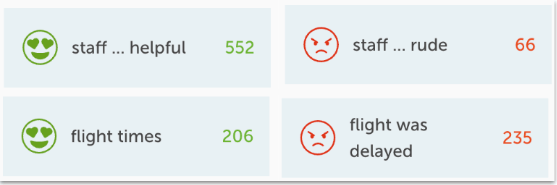
2. Unsupervised Topics
What are unsupervised topics?
Unsupervised topics identify the commonly used words and phrases discussed by customers, without any training or set-up required. They are instantly available, giving you a good feel of what your data says with no effort.
- Find surprises in the data
- Find what’s emerging in the data set
- Spot polarising subjects by identifying any topics which are discussed with both positive and negative sentiment
💡 Why are topics important?
Relying exclusively on predefined categories for analysing conversations may lead to missed opportunities for uncovering unexpected insights and emerging trends. With topic analysis, you can discover surprising elements within your data.
When working with new data sets, topics give you a quick, clear overview of the data, so you can efficiently identify initial points of interest.
The nerdy bit
The Wordnerds Topic algorithm uses probability, and the structure of the language, to establish how likely a fragment is to be interesting to you.
- First, we put the data through an Artificial Intelligence that breaks down the grammar of the sentence, looking at the job each word is doing in the sentence, and how the words are interacting with one another.
- We then find the words that are doing a job in the sentence that matters to the meaning.
- We look at how the other words are interacting with these key words, finding the collections of words that are being used together more often than you would expect, given their overall use.
- We then attach a sentiment score to these fragments, using another neural network to establish whether the context is positive or negative.
- Finally we establish whether the fragment is used as part of a question.
Why can't I classify my data just using Topics? Do I really need Themes?
- Getting an immediate feel for what's in your data, no training/setup required
- Finding surprises - the things you didn't know to listen for
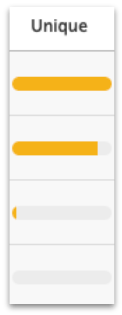
4. Unique
What is unique?
Unique uses a probability metric to identify which issues are more specific to filtered data sets.
Unique can be a helpful tool for discovering how different customer groups or segments may be affected by specific issues. For instance, if you have filtered to data from customers in the North of your region, and they are discussing a particular topic more than those in your other regions, that topic will show up as more unique👇
💡How is unique useful?
While understanding the volume and sentiment of discussion on a particular issue is valuable, it is often more helpful to put this in context and see how unique an issue is to a specific segment of customers, or how much it overlaps with another theme.
The nerdy bit
The technology works by looking at the filtered data set and comparing it with the other data in the project. The more unique a theme or topic is, the more specific it is to the filtered data set. For example, it is an issue only discussed in the filtered data set, or it is an issue discussed in a higher proportion within the filtered data set.
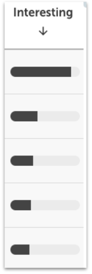
5. Interesting
Interesting applies to topics, and indicates the strength of the connection between words in a topic. It shows the statistical likelihood that this is a proper topic (not just a coincidence)👇
Interesting can also apply to words. It shows words which are used more in your dataset, than in the English language as a whole.
💡When would you refer to interesting?
Interesting is a useful way of raising topics that are not brought forward by volume or sentiment, and allows you to interrogate the data in another way. At a word level, interesting can raise terms which are specific to your market, highlighting issues across you and your competitors.
The nerdy bit
We identify topics by looking at how different words connect with one other. This metric shows the strength of the connection between the words in the topic, by showing how unlikely it was for this connection to happen by accident. The higher up the scale, the stronger the connection, the lower the likelihood that these words came together by chance.
 ✍️ Article written by: Zoe, Customer Success Manager
Still in need of some help? Give us an email on support@wordnerds.ai or reach out to your CSM directly.