- Introduction to 'Explore'
- Refine the dataset you want to analyse using filters
- Structure your analysis and drill into your data using 'Deep Dive'
- See what issues are trending in your data using 'Trending'
- Get an immediate feel for what is in your data using 'Topic Analysis'
- Discover every detail using 'Inbox'
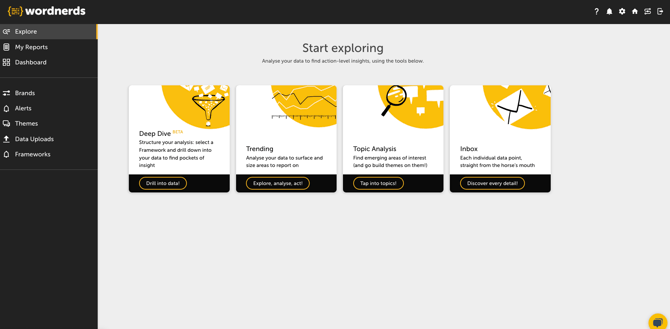
Analyse your data in 'Explore'
'Explore' is the primary analysis section in the platform.
After clicking into the project you want to work in, you will see the Explore homepage and your screen will look like this:
Use filters to refine the dataset you want to analyse
When you select any Explore feature, as with other areas of the platform, you will come to the filter page. You can edit your filters to refine the dataset you want to analyse. The default setting is to look at all data from the previous month. As you add more filters, you will be reducing the size of the dataset to be viewed.
Filter by date range
You can either pick one of the preset date ranges from the drop-down or set your own custom range. If you add a fiscal calendar to the project, your custom ranges can also align with your organisation’s fiscal periods.
Whatever date range you choose, when you’re in ‘Deep Dive’ or ‘Trending’ you’ll automatically see a comparison with the previous equivalent period. For example, if you select ‘Previous month’, you’ll see data for that month plus how it compares to the month before. If you select ‘Previous quarter’, you’ll see the previous quarter and how it compares to the quarter before that, and so on.
For a handy guide on how to update your fiscal calendar, click here.
Filter by 'Brand' (or data source)
Depending on how your project is configured, ‘Brands’ will usually represent either the different brands you’re analysing, or the different data sources you’ve connected (or uploaded) into the project. You can choose to analyse all ‘Brands’ together, focus on a single one, or select any combination.
Filter by 'Theme'
You can filter by any 'Theme' in your project. These can be 'Themes' you have created and 'Themes' you have uploaded using the metadata attached to the verbatim you want to analyse.
Looking for more information on Themes? 👉 What are 'Themes' in Wordnerds?
Select a 'Framework'
For Deep Dive, the filter page will also allow you to select a 'Framework' (from the drop-down options in the top left). Frameworks are fully customisable and can either be composed of a group of 'Themes' or 'Theme Categories' that, together, form a lens through which you want to analyse your data - e.g. the stages of your customer journey, by NPS group, or business unit.
The filter page will look something like this:
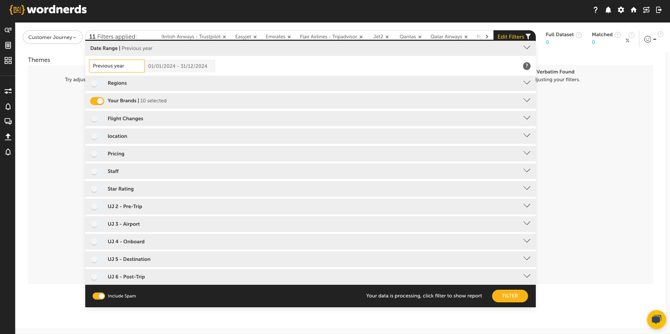
Once you have selected your filters, click 'FILTER' at the bottom of the page to apply.
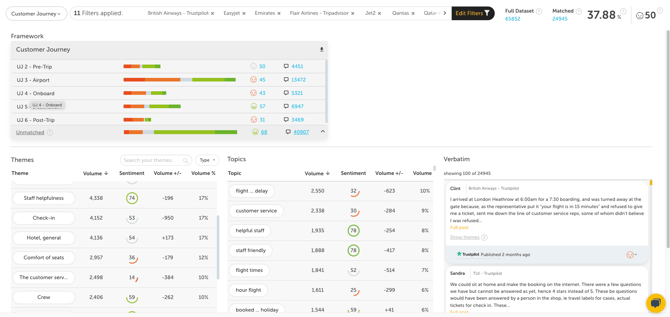
Structure your analysis and drill into your data using 'Deep Dive'
'Deep Dive' combines elements from the rest of the Explore section, 'Trending', 'Topic Analysis', and 'Inbox', into a single interface that allows you to drill down into your data and get to action-level insight.
Deep Dive is great for...
- Analysing your data using a custom 'Framework' that is a relevant lens for understanding your data
- Finding key drivers and overlapping issues
- Seeing how an issue varies between groups - e.g. customer segments, business unit (or anything you've categorised into a 'Theme')
- Using a combination of your custom 'Theme' categorisations and unsupervised 'Topics' as you drill down, so you don't miss the things you don't know to listen for
- Linking your findings to relevant customer verbatim to help give additional context and tell your data story
Deep Dive will look something like this:
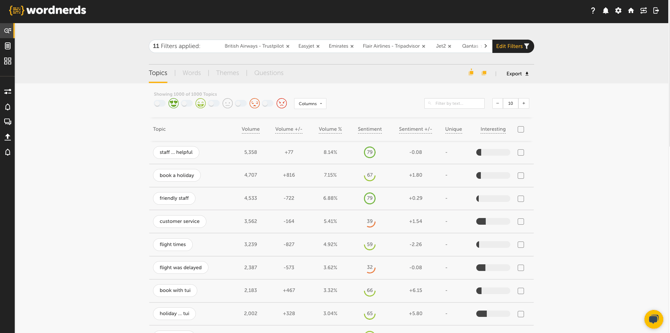
See what issues are trending in your data using 'Trending'
'Trending' reveals what is being discussed in your data using the 'Themes' you have created and uploaded, as well as unsupervised 'Topics', words and questions.
Trending is great for...
- Sorting by volume, sentiment, and increase or decrease in volume and sentiment compared to the previous equivalent period
- Allowing you to set a minimum threshold, so you only see the issues being discussed over a volume that is meaningful to you
- Getting a more precise percentage of your data discussing an issue ('Deep Dive' rounds to the nearest whole number)
- Customising the columns you want to view
- Easy filtering by sentiment group
- Exporting the table (as seen on screen), posts (the full body of text) or snippets (sentence level)
Trending will look something like this:
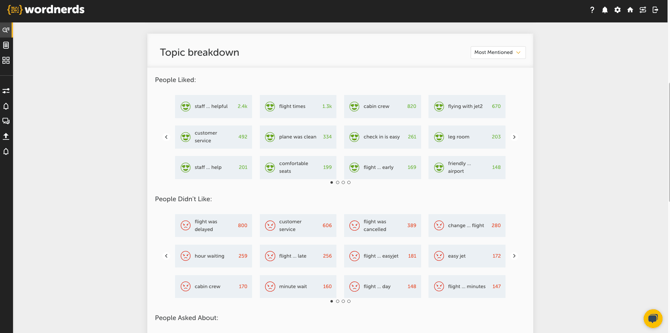
Get an immediate feel for what is in your data using 'Topic Analysis'
'Topic Analysis' relies solely on unsupervised 'Topics', meaning that absolutely no training or 'Theme' setup is required.
Topic Analysis is great for...
- Finding issues (surfaced as 'Topics') that you want to categorise together in a 'Theme' - this is especially helpful for a new or unfamiliar dataset where you may not otherwise know where to start
- Giving a clear visual of what people are positive and negative about with emoticons representing the five sentiment categories
- A high-level trend on sentiment and volume (using 'Sentiment Trend')
- Surfacing 'issues within an issue', by filtering to a 'Theme' you have already created to view the 'Topics' within that specific conversation
- Seeing the most mentioned words and the 'Topics' they are mentioned in (using 'Detailed Breakdown')
Topic Analysis will look something like this:
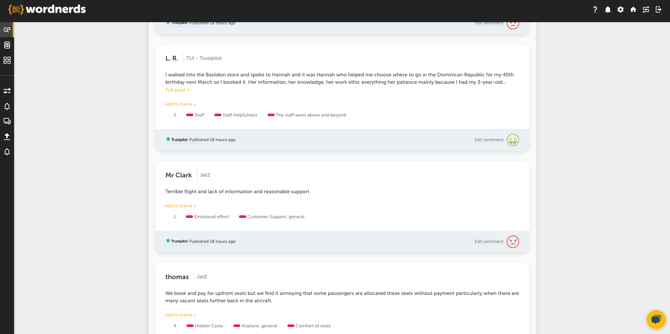
Discover every detail using 'Inbox'
'Inbox' is your gateway to each date point, allowing you to see every post in full.
Inbox is great for...
- Seeing the full context around how an issue is being discussed
- Viewing all corresponding themes associated with a post
- Exporting posts in full
Inbox will look something like this:
 ✍️ Article written by: Nat, Customer Success
Still in need of some help? Give us an email on support@wordnerds.ai or reach out to your CSM directly.